The Intel Warning
By Duru
July 17, 2004
Sometimes the worst thing about bear markets is that they unfold so slowly that you do not notice until it is too late. Trading and investing in 2004 has been so difficult because the market has refused to sustain rallies or sell-offs. However, things seem to be slowly changing. Now, more and more stocks are hitting 52-week lows. Perhaps most telling, and most alarming, (for tech anyway) is that some of the big-cap stocks in the Nasdaq are hitting these yearly lows on a regular basis (see stocks like Oracle, Intel, and Siebel).
This week, Intel joined the 52-week low crowd in very dramatic fashion after the market up-chucked on its latest earnings report. I decided to pull up the long-term chart to see whether this panic represented a buying opportunity. Instead what I found were several signals that I claim should make anyone at least squirm in his/her seat. This piece is NOT a recommendation to buy or sell Intel. Instead, I want to use Intel as a bellweather of technology stocks and suggest that the long-term picture should cause us all to take very careful note.
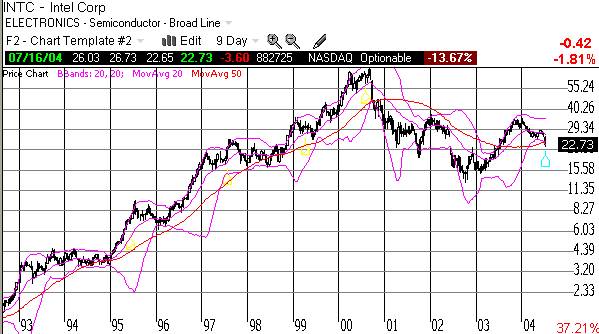
First, the long-term 9-day chart (each block of the chart represents 9 days of trading):
You technicians out there probably notice four important things:
For those of you not so technically inclined, the main thing to note from the Intel chart is to see how slowly the correction from the bubble is taking place. The lows of 2002 and 2003 looked like the final end of the pain. But the chart above shows there is STILL plenty of air below a stock chart that for almost a decade nearly SPRINTED non-stop! Just as Intel's bull market occurred over a long span of time, I am suggesting that this subsequent bear market is also unfolding on a similar scale.
Is it crazy to think that Intel can return to 1995-1996 levels? After all, that means about $10 - a more than 50% haircut from here! I would answer this question to by saying that all it would take is a general slowdown or stagnation in the economy (seemingly in the works as I write) and a huge write-down in inventories (also seemingly inevitable with Intel building inventories along with the rest of a lot of the technology market) for the entire market to get viciously bearish on Intel. This bearishness would continue the sell-off that began in 2000 and took a small pause in 2003. The bearishness would spill into almost all of technology. On a valuation basis, a 50% haircut would merely send Intel back to more "normal" valuation metrics the preceded the peak of the bubble. The chart below is quite telling. It shows that in the early 90s, investors did not pay much for Intel's profitability. Now that Intel is LESS profitable (in terms of net profit margins), investors are willing to pay MORE! Sure, you can argue inflation and interest rates all you want but both of these have bottomed for perhaps a very long time to come. The wind is no longer behind our backs; it is moving in front of us.
See
http://moneycentral.msn.com/investor/invsub/results/compare.asp?Page=TenYearSummary&Symbol=INTC
Again, I am not recommending a buy or sell on Intel. I do know that the action in 2004 tells me that the correction from our most historic of bubbles is not over and has merely taken a pause. So, I do not expect the correction going forward to work according to the plans of the bears. We should continue to see plenty of rallies going forward to keep up false hopes. For example, I am still waiting for that pre-election rally…
As always, be careful out there!
Ó
DrDuru, 2004