|
|
Every now and then it is useful to pick your head up and take a look at the overall landscape. When I did that recently on the NASDAQ, I was surprised to see that the longer-term chart for this index of technology stocks is looking better and better all the time. As you know, the NASDAQ, and all the major indices, bottomed in 2002 and shot nearly straight up for most of 2003. Ever since then, the NASDAQ has done a lot of churning and chopping, and it has spent a lot of time going down. But after it has all been said and done, a definite up-trend has been in place for about the last 18 months. See the chart below.
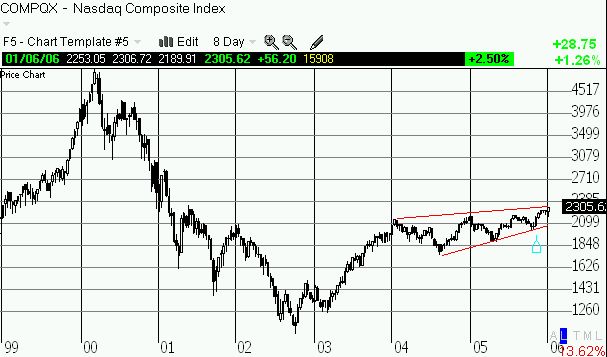
This long-term (9-day) chart shows that the NASDAQ has lately made ever so subtle higher lows and higher highs since the big swoon in the first-half of 2004. It is even now 10% above the post 9/11 highs that have acted like such a magnet the past two years. I imagine we will re-test that level later this year, but a move to 2500 must be in our near future. Maybe this will be the big story for 2007? I dare not get wild with predictions because both the Fed and the global economy look like big wildcards to me. Regardless, do not forget that 2500 marks the 50% point of the tech bubble highs. Traders will have a lot of fun playing around with that technical level, and I imagine we will get numerous headlines and stories calling attention to it. Thus, expect a lot of resistance at 2500.
But first things first. We just had a remarkable start to the new year. For now, all looks good for buying on weakness...at least until the Fed moves to switch up the game on us. As always, be careful out there!