|
|
The Bottom Is Here for Housing Stocks - Unless...
By Dr. Duru written for One-Twenty
February 23, 2006
The evidence of a bottom continues to mount for a bottom in housing stocks. I should be able to declare "victory" soon unless Toll Brothers stinks up the joint in their Thursday morning earnings conference call. Toll has offered the market a string of bad news for several months now. The latest sour note came on February 8th, and the market recoiled instantly on the news. But the collection of housing stocks also did not go much lower from there...even after KB Home snuck some bad news forecasts in its latest 10K. Short of an actual recession, one must wonder how much worse can the news get for these homebuilders? I know you all must be getting tired of this endless chatter about the housing bubble and homebuilder stocks, but I am at least enjoying it. Besides, these missives serve as a great record of my thinking at specific times - I can come back and check on how well I am doing with my prognostications and even get a chuckle or two out of my gaffes. Besides it beats my currently dormant habit of sidetracking into political diatribes, right?
Anyway, let's review the most significant housing news that has surfaced since I last visited the homes of housing stocks.
- Wed, Feb 15: Washington Mutual responds to slowing mortage demand by cutting 2500 jobs and closing 10 loan-processing offices - a 38% reduction. The Mortgage Bankers Association also reported sizeable declines in weekly mortgage applications. Finally, Federal Reserve chairman Ben Bernanke issued a dire warning about the housing market in his first semiannual monetary policy report to Congress: "...given the substantial gains in house prices and the high levels of home construction activity over the past several years, prices and construction could decelerate more rapidly than currently seems likely." Big Ben is definitely speaking much more plainly than his predecessor Obtuse Greenie! After all this, the Philadelphia Housing Index barely budged.
- Thurs, Feb 16: The U.S. Census Bureau and the Department of Housing and Urban Development announces large increases in housing starts. Privately-owned starts jumped 14.5% from December to Januart and 4.0% year-over-year. Apparently, we have not seen such levels since early 1973. Single-family starts were up 12.8% over December. This boom in starts was widely interpreted in the media as negative because it meant that inventories of unsold homes are about to surge. The Philadelphia housing index went up over 1% for the day anyway.
- Tues, Feb 21: Pulte Homes informs attendees of its annual investor conference of what appears to be a gangbuster forecast: reiterated profits from continuing operations of $6.00 to $6.25 a share compared to the $6.07 consensus; $6.60 to $7.20 for 2007 versus the paltry $6.18 consensus; they even dared to declare insight into 2008 numbers - $7.25 to $8.25 a share, meaning a worst case scenario of 10% growth and best case growth of 25%. Amazing stuff I would say! Most importantly, Pulte claims that "macro trends point to sustained demand" with greater fluctuations year-to-year. No admission of an imminent crash here. The market "yawned" with a 2.4% pop. Interestingly enough, the release of the minutes from the last Federal Reserve meeting revealed a relatively optimistic attitude amongst the meeting participants about the effects of a slowdown in the housing sector: "...the effects of a leveling out of housing wealth on the saving rate were difficult to predict, but, in the view of some, potentially sizable. Rising debt service costs, owing in part to the repricing of variable-rate mortgages, were also mentioned as possibly restraining the discretionary spending of consumers. The most likely outlook, however, was for a gradual moderation in house price appreciation and in the growth of consumption, which would continue to be supported by increases in jobs and incomes."
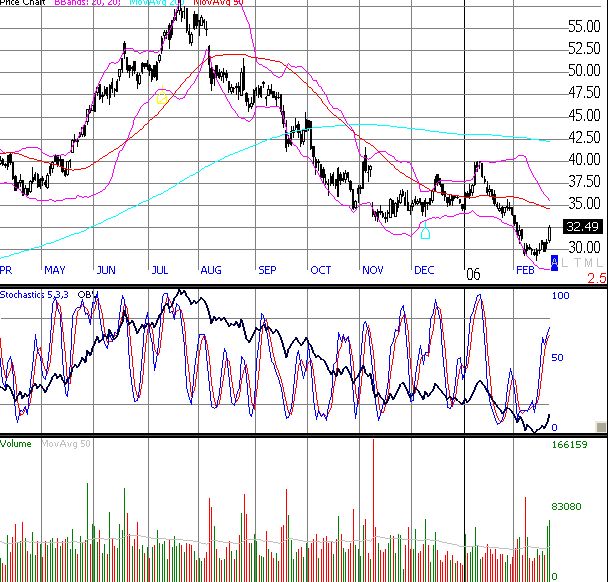
- Wed, Feb 22: Hovanian announces a preliminary quarterly financial report. In it the copmany announced sizable gains in the dollar value of contracts and housing backlog. (Makes you wonder whether there just might be enough to demand to soak all those housing starts!). They also admit that "...many of its more highly-regulated markets, including California, Florida, Washington, D.C., and the Northeast, continued to experience a more normalized level of activity during the quarter with regard to both sales pace and price increases..." This means that Hovanian is admitting to slower growth, but nothing close to a crash or collapse in the market. The stock soared 6%. Taking it right to the 50 day moving average (see chart below). While Pulte's news only moved the sector a small bit, Hovanian's news sent the whole sector soaring. On top of all this, the Mortgage Bankers Association finally reported a weekly increase in mortgage applications.
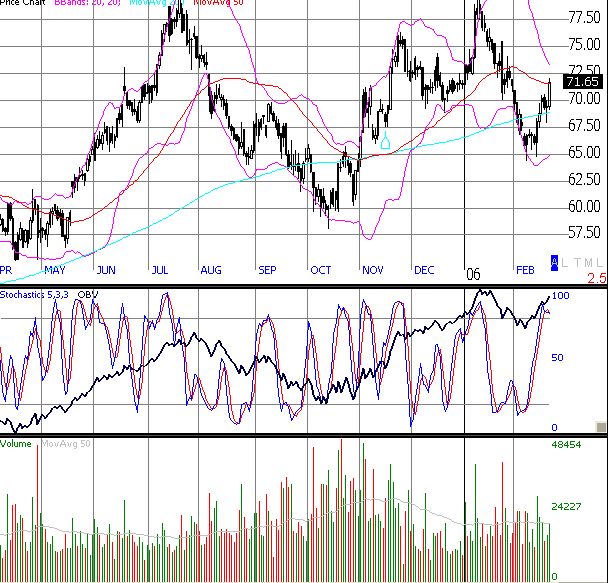
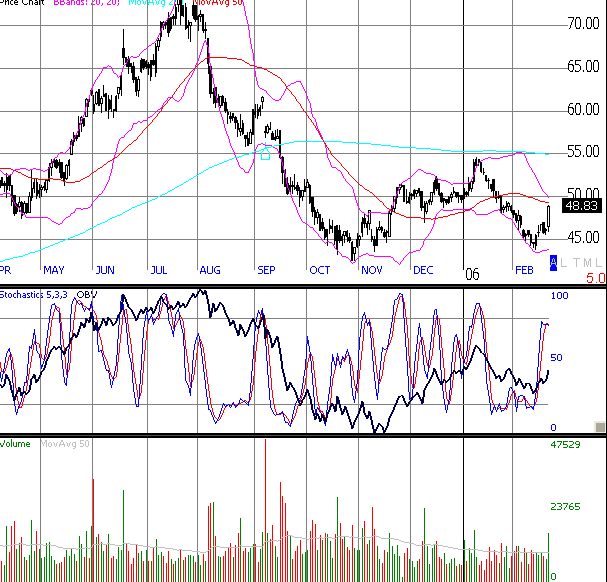
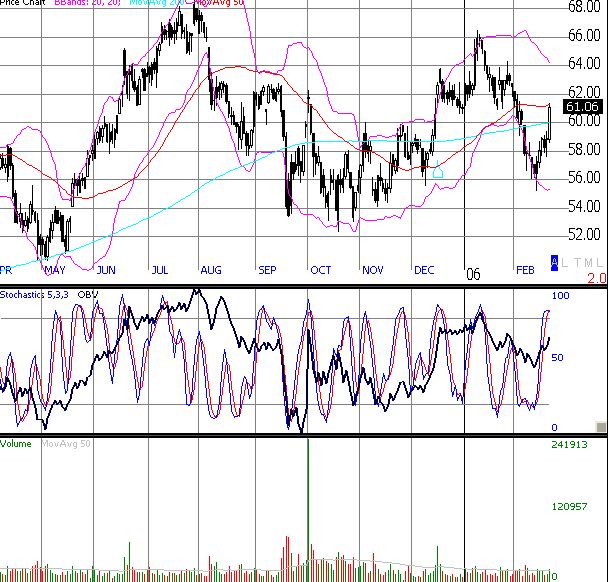
This story would not be complete without a review of the price action. This time, I present a whole slew of charts of the homebuilders I follow the most. I post daily action for almost the last year and include volume and some technical info like stochastics, OBV, and daily moving averages. I post these charts without additional comment, but it should be immediately obvious to you that declaring a bottom here is still risky business. Many of these stocks have ugly charts featuring nasty breakdowns and wicked downtrends. These stocks have come down a long way and still have plenty of "air" underneath to tumble further into. Centex remains the homebuilder with one of the healthiest charts of the bunch and Toll Brothers is one of the worst. (See disclaimer here.)
As always, be careful out there!
CENTEX
HOVANIAN
LENNAR
MERITAGE
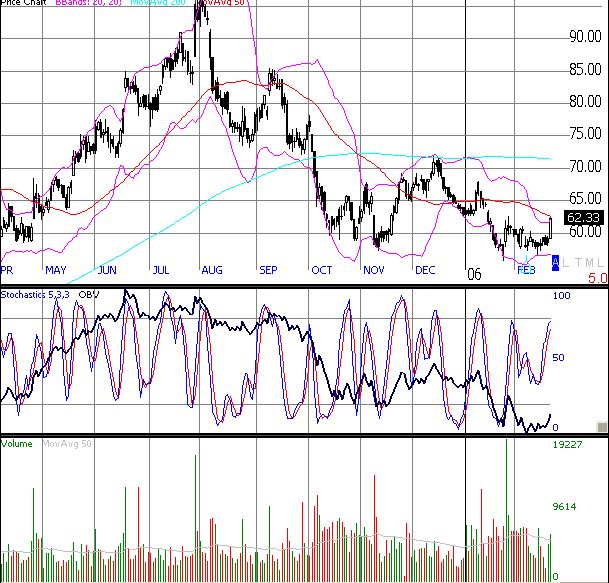
PULTE HOMES
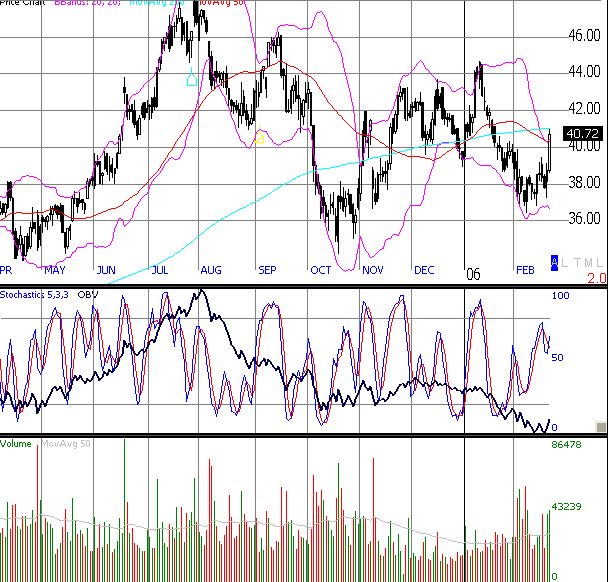
RYLAND
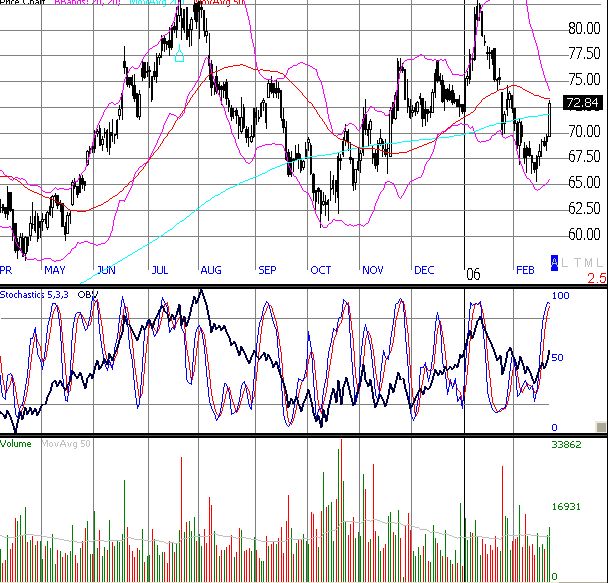
TOLL BROTHERS
