Almost one month ago, on May 18, the stock market experienced its first bounce from oversold conditions since the rally from the March lows. I noted several important characteristics that had changed about the stock market. The most significant was that the percentage of stocks trading above their 40-day moving average (T2108) dropped below 80% for the first time. A trader would have missed an additional gain of 3.2% (7.3% maximum gain) if s/he had sold out of the S&P 500 at that time (the trading day before the bounce) using the "T2108 capital preservation strategy" with an 80% threshold for T2108. I actually examined this strategy using 70% as the selling threshold. On Monday, T2108 traded below 70% for the first time since March 31, 2009, generating another significant change in character for this rally. I am surprised that this drop occurred at a higher level on the S&P 500 than the first drop below 80%. However, this event may provide an even stronger validation point for the T2108 capital preservation strategy using 70% as the threshold for selling.
The stock market spent a total of 51 trading days with T2108 above 70%, placing this rally in the top 3% of all rallies since September, 1986. This historic bear market continues to post a string of extremes. For now, the rally is still in an (intermediate) uptrend and remains healthy from a technical standpoint. I suspect the S&P 500 will continue approaching oversold conditions and bounce again from there. In the meantime, I have noted three other interesting character changes that warrant monitoring as this rally tries to extend into the summer:
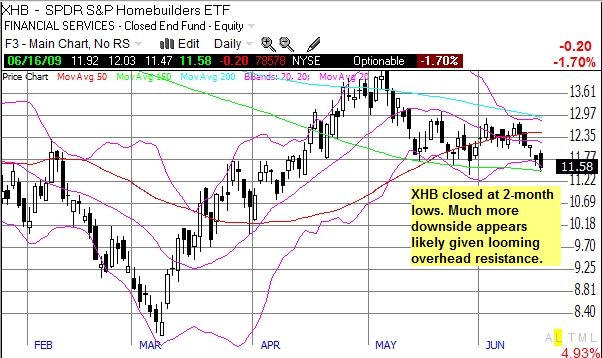
- The homebuilder ETF, XHB, closed at two-month lows and is fading away from resistance marked by the 50DMA and the 200DMA (see chart below).The declining 200DMA confirms the on-going downtrend. Some think that housing has bottomed (or it will within months) and most believe that housing is key for a healthy economic recovery. The trading action in XHB does not bode well for a housing bottom, and it is demonstrating a non-confirming signal for the expected recovery. (If the stock market's magic forward-looking indicator is working here, XHB tells us that something is now "wrong" with the recovery in housing.)
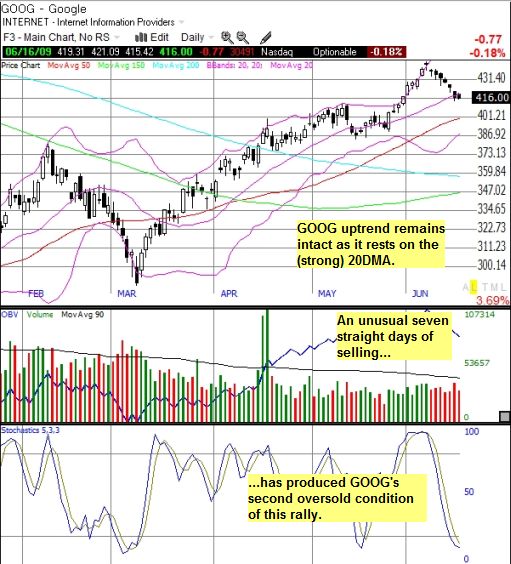
- Google (GOOG) has now traded down seven consecutive days. This has not happened since the rapid selling from last Fall. Unlike the S&P 500, GOOG is already at oversold conditions (see chart below). Given GOOG sits right at the 20DMA, which has so far supported the bulk of GOOG's rally (like so many other stocks), its subsequent trading behavior could provide clues as to what to expect from oversold conditions on the S&P 500. Google is a critical element of the "Gripple" trade (GOOG, RIMM, and AAPL) that remains the hallmark of bullishness in tech, so its behavior should be an important tell on bullish sentiment. I will be watching this one closely.
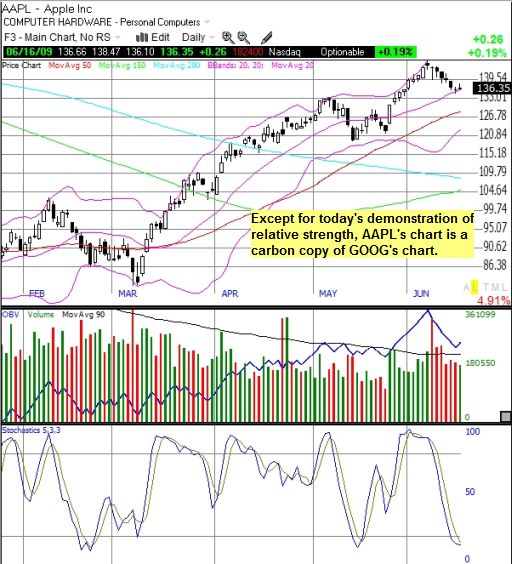
- Similarly, Apple (AAPL) has traded down 6 of the last 7 days. AAPL displayed excellent relative strength on Tuesday as it managed to close just above flatline to break the selling streak. Its chart is almost a carbon copy of GOOG's: oversold, sitting at the important 20DMA support line, and appearing ready to bounce. (See chart below).
Overall, the stock market appears to be undergoing another character change. For now, these signals tell me the rally continues to slow down, not yet topping. However, persistent weakness from here will signal more ominous overtones for the health of the rally.
Be careful out there!


Full disclosure: long SDS, SSO calls, AAPL calls, RIMM puts, GOOG puts, XHB puts. For other disclaimers click here.