Click here to suggest a topic using Skribit. Search past articles here.
Everyone knows the old saying to sell in May and go away. Jacobsen and Bouman find worldwide evidence that stock market returns are better from October/November to April than from May to September/October, but they are at a loss to explain the pervasiveness of the effect. This effect can be observed in the United Kingdom since 1694! (Thanks to "OC" for this reference). Some folks have run the numbers to conclude that this adage does not represent helpful investing advice. For example, Prieur du Plessis concludes that since average monthly returns on the S&P 500 are positive every month, the average investor might as well just hold throughout the year. So what that the average returns are lowest between May and October. The Bespoke Investment Group shows that the Dow's performance from May to September varies widely depending on your timeframe.
So, whether or not you care about "sell in May" depends on your objectives and investing/trading style. But this adage is held so widely and so strongly, there must be something more to it. I decided to look at May from a different perspective. I decided to compare lows and highs, the reason being that folks most remember high and low points and not average returns. It is the peaks and the troughs that carry the most emotional weight and persist in the memories of folktales. I think you might find these numbers interesting. Note that I have expanded the analysis to look at May compared to the rest of the entire year and not just through September.
All analyses were done using the S&P 500 from Jan 1, 1962 to Dec 31, 2007, a sample of 46 years.
The lowest close on the S&P 500 in May was broken in 31 of the last 46 years (67%) in the remaining months of the year. December holds 50% of these back-breaking points.
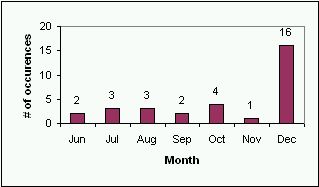
In other words, 1/3 of the time, the May low is the sorest point for the rest of the year. But just as often, December disappoints by erasing all gains made from May. Perhaps those ugly Decembers are enough to make folks regret not selling in May.
A look at the highs, gives us another twist. In only 6 years, the May high was never achieved again for the rest of the year. The vast majority of the time, the May high was surpassed the very next month in June!
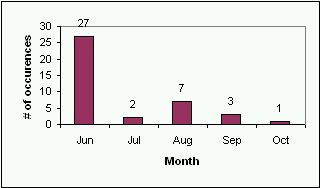
This shows that if you are a nimble trader, June typically gives you another chance to get out of the market if you did not catch the high in May.
Again, in only 8 years, the May high was never achieved again after June. July typically provides the nimble trader yet another good shot at getting out of the market if s/he missed both the May and June opportunities.
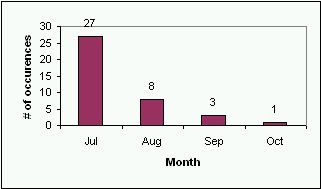
The story is similar again if we look at the point where the May high is first broken after July or first broken after August. In only 11 years did the market fail to break that May high after July, and 12 years if measured after August.
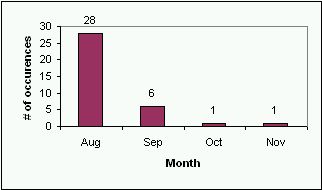
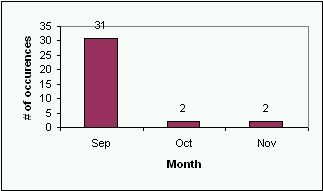
In other words, it is not typical for the market to top out in May for the year. When May is not the high for the year, traders get all summer long for repeated chances to bail for the year.
So, is there a month that is more prone to highs on the year or lows on the year? Well, the charts below show that 59% of the highs come in the last 3 months of the year, and only 28% come in May or earlier. December leads the pack for highs. 52% of the year's lows come in the first 3 months of the year with January leading the pack.
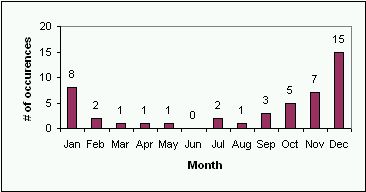
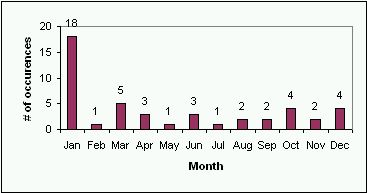
All and all, these statistics reinforce the conclusion that calendar-based trading can be a crapshoot for all but the most specific scenarios. Nimble traders get plenty of opportunities to choose their favorite entries and exits. The big question mark in all this? What conditions are most favorable to supporting the above statistics? I leave this to you super quant jocks.
Be careful out there...!