The Market Clings to the Latest Narrative of A Bottom
By Dr. Duru written for One-Twenty
December 9, 2008
Share Click here to suggest a topic using Skribit. Search past articles here.
The latest bottom in the market continues to hold. Ever since I concluded that the latest bottom was the most convincing since the sharp sell-off that began after Labor Day, the S&P 500 is up 7%. More important than this "meager" gain has been the market's behavior over this time. We are now 11 days out from the last bottom and still within the embrace of a (very) short-term uptrend. That is the best streak yet of the past 3 months. The historic one-day correction of -9% that started December was stopped cold and subsequent buying has taken the market to a higher high (and higher low). However, the horrific jobs report on Friday gave me considerable pause. The massive job losses recorded in just the past three months seem to warn us that the economy is going to get much worse before it gets better. I wanted to get very bearish on the market all over again after Friday's data, but after some friendly back-and-forth with my good friend TraderMike, I put aside the fundamentals regarding what the market should do and prioritized the technicals regarding what the market is doing. The contrarians who automatically buy on the heels of very bad news have held their ground, and there are currently enough traders and investors willing to guess one more time that a recovery is somewhere in sight.
The chart of the S&P 500 has some critical points identified by a numerical index that is explained below the chart.
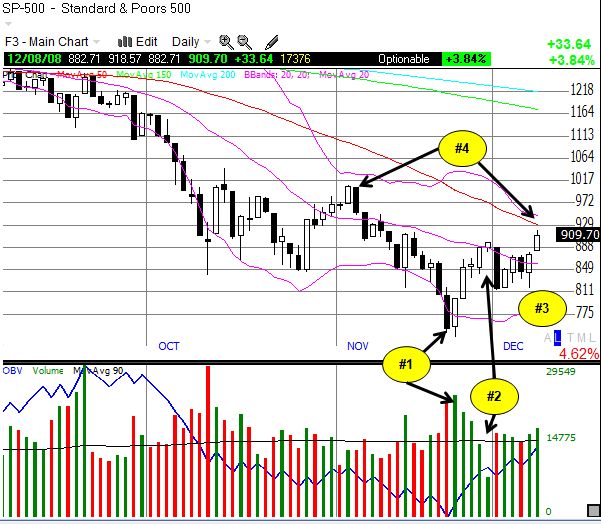
- High-volume, swift reversal of the selling crescendo.
- Low-volume holiday shopping set-up the next selling opportunity for the liquidators.
- With no follow-through forthcoming on the selling, a new support forms around 815. This creates a higher low that sets up Monday's higher high.
- Plenty of resistance above at the 50DMA and the November highs. Trading above the November highs would signal a more sustainable bear market rally.
So, assuming that the bear rally get enough fuel from the current narrative, the bias is to buy the dips on strong stocks and sprinkle in single-digit speculative stocks for extra "beta." The retail sector is full of companies gasping for life whose stocks can provide a lot of leverage to the upside when the market speculates they will survive. It is also possible that they may benefit from the legendary "January effect." I am going to focus here on some charts of less speculative companies that look particularly promising. I looked for stocks where the recent rally has sent the chart above the 50DMA on high volume, above recent resistance levels, and preferably created a bounce from a W-bottom, with an extra bonus for higher highs and higher lows. It should come as no surprise that these charts are dominated by cement companies and infrastructure plays. I was hoping to see more commodity names pass the test, but the comprehensive damage to these names has produced exceptional overhang. Note well that I am more focused here on the short-term action than the long-term. In all cases, each stock faces stiff resistance overhead and/or is still well within the confines of longer-term downtrends.
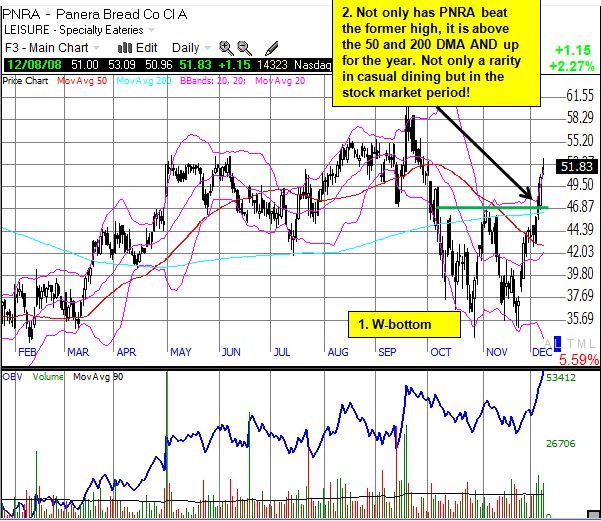
PNRA is a rare breed of stock that is not only above the important 50 and 200DMAs, but it is also up for the year. This is doubly impressive for a casual dining company that depends on consumer's discretionary spending in a recessionary environment. Shorts in this stock represent a whopping 32% of the float. So if PNRA continues to deliver decent earnings reports, there could be a lot more upside for PNRA in the short-term as shorts scramble to get out of the way. I will continue to eat there once a week to do my part.
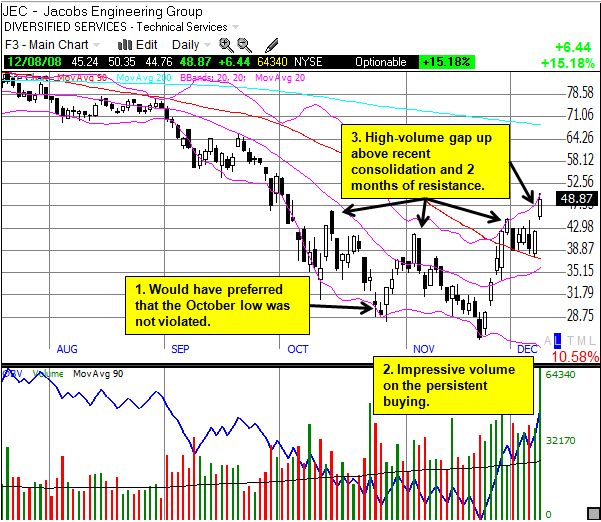
Fluor (FLR) is my favorite infrastructure play. Since its chart is nearly identical to JEC's, I thought I would post JEC just for something different. On November 6, FLR raised EPS guidance for fiscal year 2008 (FY08) to $3.70-3.80 compared to the $3.52 consensus. FLR provided a cautiously optimistic outlook: "For 2009, the company acknowledges the possibility that a prolonged economic downturn could moderate the demand for large capital expansion programs globally. While the potential exists for near-term decline in demand in certain of our markets, based on our current prospect list and the substantial earnings power of the existing $36.5 billion backlog, we are establishing initial 2009 earnings guidance in the range of $3.90 to $4.20 per share." This guidance is in-line with the $4.01 consensus. FLR is up 50% since the market sold off the stock ahead of earnings.
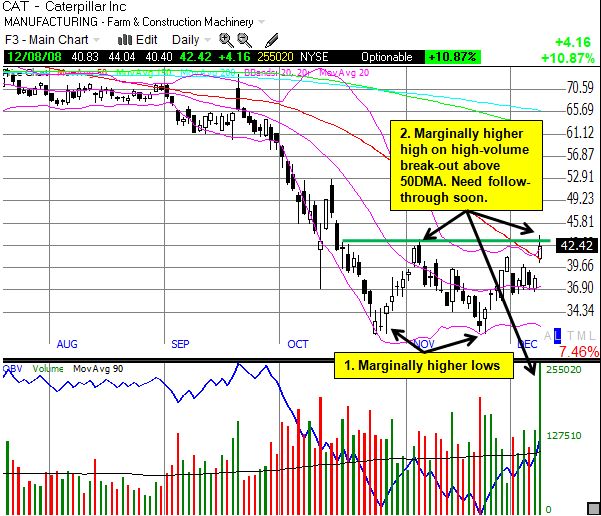
CAT did not quite meet the criteria I stated above, but I posted it anyway because of its potential. It is also a leading company in the equipment used in infrastructure build-outs.
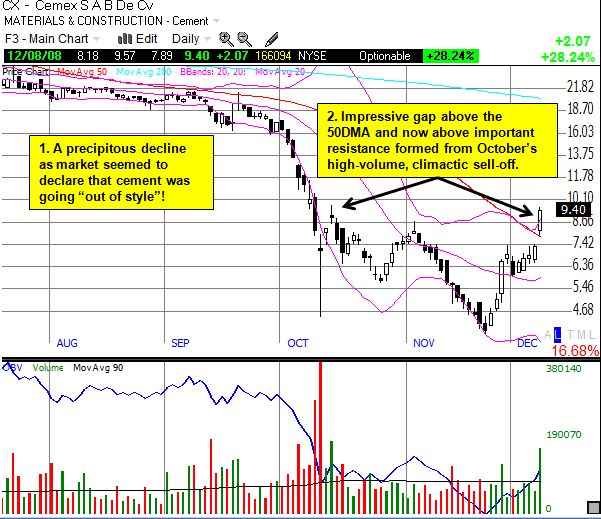
I believe the market slammed Cemex particualrly hard because of fears that it would not survive its large debt of around $10B versus $1B in cash. But with a P/S ratio of 0.4 and a P/B ratio of 0.6, CX provides you with a play that should be highly leveraged to the current recovery narrative.
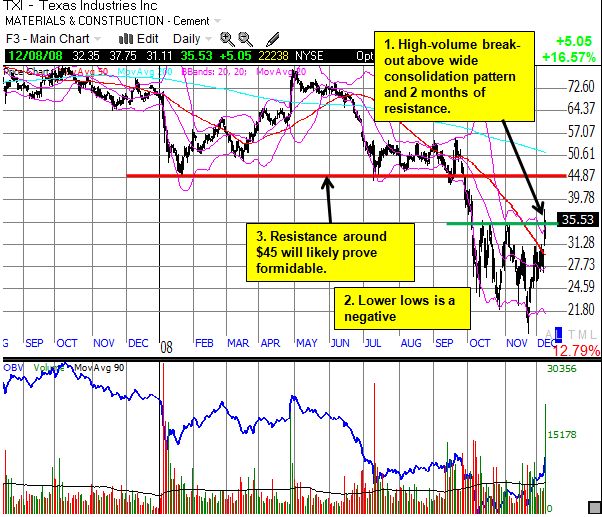

TXI has a higher valuation than CX, but it is also appears healthier financially. For example, its debt load looks much more manageable at $539M versus $119M in cash.
While the economic news continues to worsen, the recovery narrative will have to get stronger and stronger to withstand the urge to sell rallies. On Monday, the market ignored MMM's warning but did not buy the stock back up into positive territory. Last night, we heard more dire earnings and revenue warnings from Federal Express (FDX) and Texas Instruments (TXN). Even if the market goes up in spite of that news, we want to see the market buy into the specific stocks to see more evidence that bad news will be ignored for now. I am also now watching short-term Treasuries. With rates essentially at zero, we have a glaring indicator of the fear that remains out in the land of cash. The over-crowding on that trade likely represents a powder keg ready to explode when more positive news finally starts trickling in. I can only assume that when the exodus happens, a lot of that cash will find its way back into stocks.
Finally note that the percentage of stocks trading over their respective 40DMAs has finally gone back above the 20% oversold level (the T2108). The market equaled the string of 42 trading days at or below the oversold mark last set during the 1987 crash. Finally trading above this line indicates the market is probably healthier than it has been in many months.
Full disclosure: long S&P 500 in an index mutual fund. For other disclaimers click here.
Share