Using the Percentage of Stocks Trading Above Their 40DMAs (T2108) to Identify Overbought Conditions on the S&P 500
By Dr. Duru written for One-Twenty
January 4, 2009
In my reviews of market health, I sometimes refer to a technical indicator called T2108, the percentage of stocks trading above their 40-day moving averages (DMAs) in price. The rule of thumb for interpreting this indicator is that the market is oversold when T2108 drops below 20%, and the market is overbought when T2108 is over 70%. More specifically, when T2108 drops below 20%, it is typically a poor time to initiate new shorts and as the indicator goes lower, traders should cover shorts. When T2108 trades above 70%, it is typically a poor time to initiate new longs, and when T2108 trades above 80%, traders should sell. ("Poor time" means the risk/reward opportunity is low). Last year, I examined the relationship between T2108 and volatility as measured by the VIX and concluded that when the VIX gets "close enough" to recent spikes in the VIX and the T2108 is below 20%, you get a very strong signal of a (short-term) bottom. T2108 is now trading at 83%. It has not traded above 80% since October 9, 2007, the day the S&P 500 closed at its all-time closing high of 1565. So, I thought this would be a great time to examine the relationship between T2108 and the S&P 500 during overbought conditions.
First note that T2108 is calculated using all stocks trading on the NYSE. It is a technical indicator provided by Telechart from Worden Brothers. Historical data goes back to September 17, 1986. Telechart provides no similar indicator for the S&P 500. It would clearly be ideal to use such an indicator, but to the extent the S&P 500 is a broad enough sample of the entire market, this analysis should be accurate enough for the purpose at hand.
After looking at the data, I conclude that the rule of thumb for identifying an overbought condition using the T2108 works well. However while S&P 500 behaves fairly predictably while T2108 is above 70%, we can never know in advance how long it will remain above that threshold. So, the analysis below is very descriptive; it explains the indicator. The prescriptive components, the rules that define the execution of a specific trading strategy, are a bit more elusive.
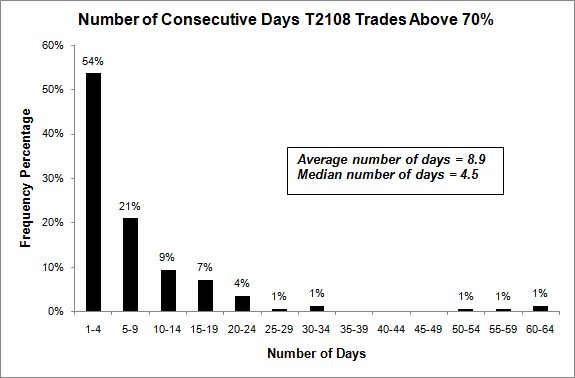
So how do we know that T2108 trading above 70% represents an overbought condition? T2108 typically spends less time above the threshold than it spends returning to the threshold. The chart below shows that the S&P 500 typically spends very few days trading above 70%: the majority of the time it is under 5 days, and the vast majority of the time (75%) it is less than 10 days. The average is 8.9 days, and the median is 4.5 days.
A return to the 70% threshold takes 1 to 4 days only 44% of the time. The vast majority of the time (77%), it takes up to 19 days for a return to 70%. The average is 33.6 days, and the median is 7.0 days.
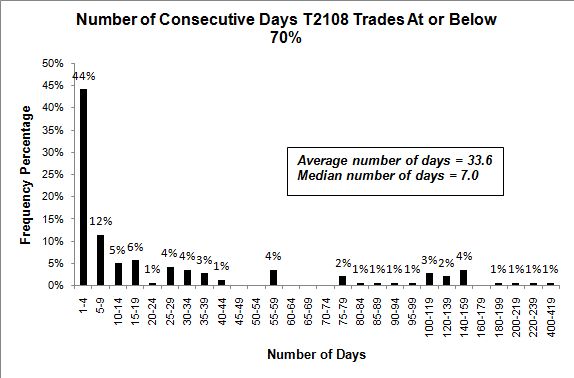
Think of this as the rule of gravity for stocks: what goes up, must eventually come down...or at least take a rest for a while. And the longer the market goes up without resting, the more likely it is to rest. No surprises there I am sure.
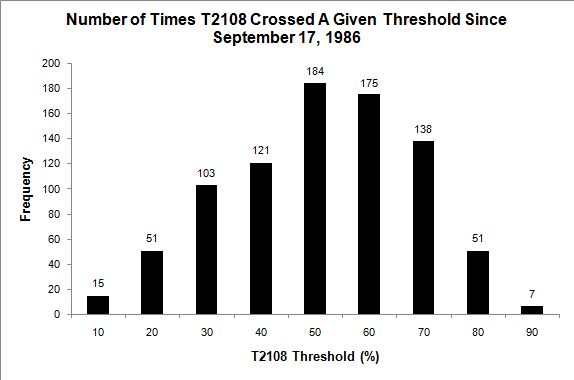
So why not use 80%, 90%, or even 60% as a threshold? Well, we should expect this kind of indicator to trigger the most at its 50% mark. That is the least useful point of differentiation. As the indicator moves higher, the more effective it should be. The chart below shows that T2108 trips the 60% threshold triggers the same amount of time as it does the 50% threshold. T2108 becomes a much better filter at 70% and a big drop in frequency occurs at 80%. By 90%, T2108 is in rarefied air. Given this breakdown, we end up with the reasonable rule of thumb that 70% represents the yellow flag (no new longs, get ready to sell), and 80% represents the red flag (seriously consider selling).
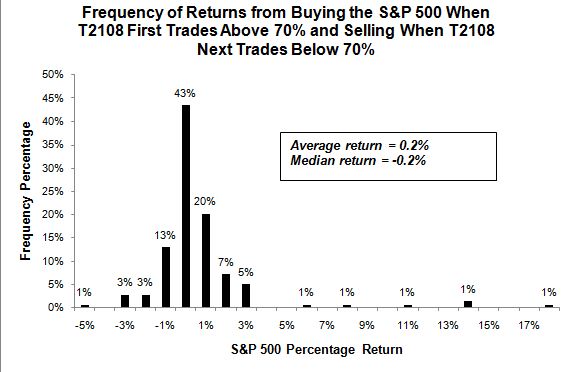
We might try to take advantage of this rule of thumb by selling as soon as T2108 dips back below 70%. This method produces nearly the same result as selling as soon as T2108 crosses above 70%. The average and median returns are essentially zero. I am actually surprised that both measures are not worse.
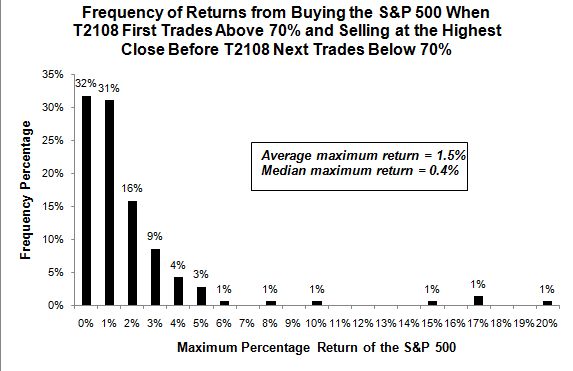
Next, let's take more risk and wait to sell. We already know that we should have about 5 days to decide when to sell before T2108 takes another dive below 70%. The chart below shows the maximum return if our timing is absolutely perfect. Notice that the median return makes only a marginal improvement from the first strategy. The average return makes a notable improvement.
Indeed, the longer T2108 remains above 70%, the higher the return. The high correlation exists for selling once T2108 dips back below 70%, and the correlation is even higher for the maximum return. These correlations are the same over the entire time period and over the past six years. Of course, the problem is that we can never know in advance how long T2108 will remain above 70%. All we know is that we should be getting ready to sell.
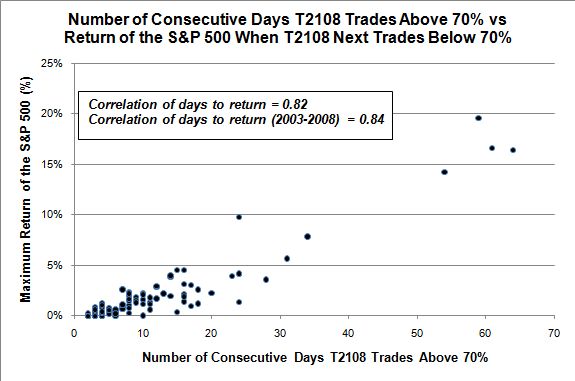
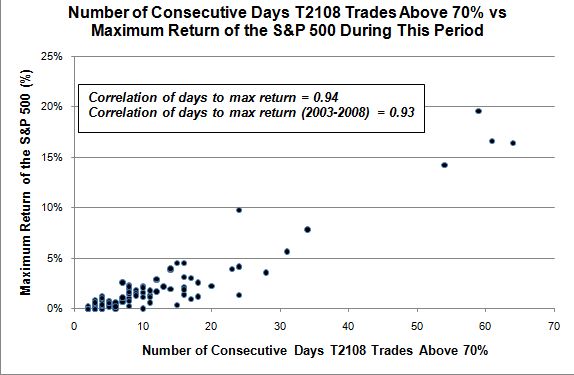
Given the above data, one of the worst things that can happen is that the trade exits the S&P 500 early during one of the outliers of maximum return. The good news is that waiting until T2108 dips back below 70% achieves the majority of the gains from these outliers (remember, it is not realistic to expect we can consistently extract the maximum gain anyway). See the table below - note that "return" refers to performance when waiting for T2108 to trigger and "max return" is the performance a perfect market timer could achieve.
| Period with T2108 > 70% | # of Days | Return | Max Return |
|---|---|---|---|
| 1/5/1987 to 3/27/1987 | 59 | 17% | 20% |
| 1/24/1991 to 4/22/1991 | 61 | 14% | 17% |
| 5/9/1997 to 8/8/1997 | 64 | 13% | 16% |
| 4/14/2003 to 6/30/2003 | 54 | 10% | 14% |
In summary, T2108 is a good overbought indicator for the S&P500. The significance of the overbought reading will depend on the kind of trading strategy you choose to initiate once the indicator triggers. Over time, if you choose to wait until the T2108 dips back below the 70% threshold you will preserve capital, preserve the gains from the previous rally, and frequently capture the majority of the maximum returns when the S&P 500 remains overbought for long stretches of time.
Be careful out there!
Full disclosure: long S&P 500 in an index mutual fund. For other disclaimers click here.
Share