The market is showing true bear market action these days. The market has come down fast and hard for the past 5 weeks. The S&P 500 has cratered below its 200DMA and is 4.4% away from testing the August lows. The hardy NASDAQ began its slide just in the past 3 weeks and almost all of that coming in 4 trading days, Nov 7 to Nov 12th.
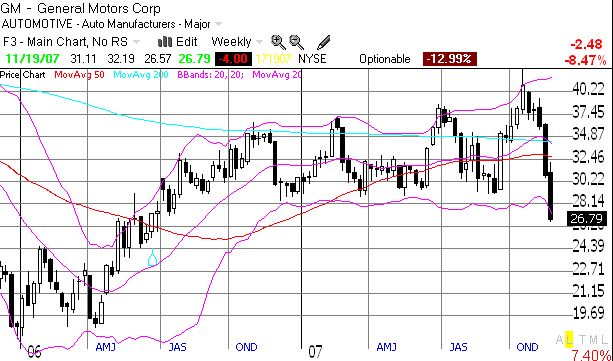
By now, we all know about the persistent selling in the homebuilder, retail, and financial stocks. The commentary is dire, and even Goldman Sachs adds insult to injury by downgrading its brethren like Citigroup (C) to a sell. Countrywide (CFC) does everything it can to save itself and every obligatory rally gets promptly faded and sold. Yesterday's 12.4% drop brought the stock to 5-year lows...and this after a 32% rally after CFC reported earnings a month ago! Industrial stocks like Caterpillar (CAT), the little lamb who cried recession, and Terex (TEX) have completely broken down. Yesterday, GM got clobbered on news that it will use 0% financing to drive sales (why is this news? Seems like American car makers have ONLY been able to sell cars over the last 10 year or so on cheap credit). The weekly chart below shows the intense technical breakdown to new 52-week lows - support just below $29 has been obliterated. For a year the stock was looking mildly promising with successive new highs. The last strong rally occured on hopes that a new labor agreement with the UAW would finally turn GM around - it even had CNBC's car expert, Phil LeBeau, breathlessly regurgitating the predictions of traders who targeted GM as high as the high-40s. I bet you are not surprised to hear that all this marked the very tippy-top in GM's shares - a classic "sucker move."

Even, the standard momentum stocks like Google (GOOG), BIDU, and RIMM have dropped 20% and more in the past month. Global stock markets are following the U.S. lower with technical breakdowns abounding in most of the corresponding ETFs.
If ever you wanted to hop on the bear-driven, recession bandwagon, this certainly appears the time to do it.
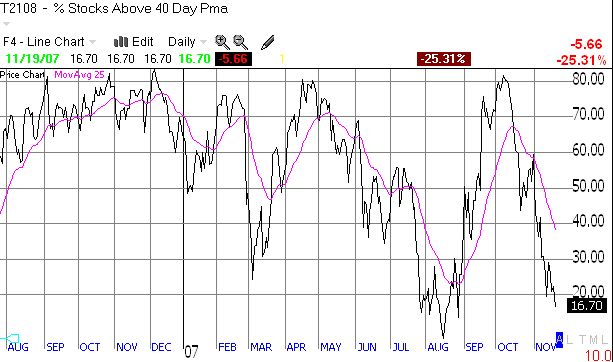
Having said all that, take note of T2108, the percentage of NYSE-traded stocks that are above the 40-day moving average.

This indicator can be used at the extremes to demonstrate when the selling or buying has become overdone. This indicator rarely spends much time below 20%. At those levels shorts should start covering even if the bulls are not quite ready to buy. The March swoon did not quite reach 20%, and the August swoon almost reached 10%. I used the T2108 on August 15 to "predict" a big bounce, and it just so happened to come after one more day of vicious selling. You can tell how vicious August was because this indicator actually lingered for almost the entire month around and below 20%. Yesterday's selling finally brought us right back below 20%. Who knows whether we get a sharp bounce this week, or next week, or later. We just know that a big bounce is somewhere around the corner. The market is getting so bad, it's getting good for buying. But as I mentioned in the last missive, I dare not speak for what 2008 holds. If we are transitioning to a true bear market mode, then rallies get sold...if the market punches through the August lows, we're in trouble. And if the March lows also get violated, run for cover.
Be careful out there!