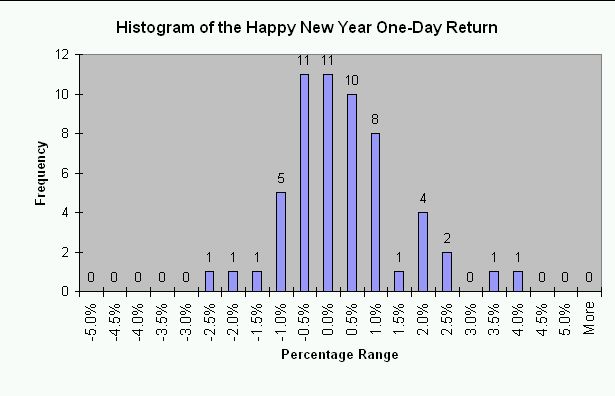
S&P 500 Performance on the First Day of A New Year
By Dr. Duru written for One-Twenty
December 31, 2007
I wanted to say something profound to hop on the cacophony of shrill voices putting forth predictions for 2008. So, I looked back over the past two years and reviewed some of the highlights of my thinking. In 2005, I remained fascinated by the market's inability to break away from the recovery highs of 2001. I ended the year with a bunch of observations, including "overall, I do not expect more out of 2006 than we got out of 2005. With all these rate hikes, cash is finally starting to get interesting." The S&P 500 was up about 7% in 2005 and up 13% in 2006. D'oh! Once 2006 got underway, I declared it the year for buying on the dips. That worked out relatively well, including the attempts to buy housing bottoms. This year, 2007, I tried to switch from a bear, to a skeptical bull, to "full bull", but the market just would not cooperate with me. Sure, buying on the dips remained a great strategy - especially for the big winners of the year in tech, energy, and China - but I was more focused on new highs in the U.S. and global markets. I did not get truly savvy about buying the dips again until the last dip to the November lows. Perhaps I got too distracted by the destruction of the "housing bottom" trade. Regardless, I remain amazed that so much sentiment seems negative, including rampant calls for recession and economic malaise and yet the S&P 500 will end up on the year, and it is only about 6% below 52-week, and multi-year highs.
So, with the market hanging on the edge of a precipice (if you are a bull), or with the market strapped into the cockpit of a jet ready for lift-off into the wide blue yonder, I am thinking trading range. I will keep my eye on the 2007 highs and the November lows for further guidance. I will be watching for extremes in sentiment (think T2107 and T2108). I will be watching volatility levels. I will be keeping an eye on what might go right, when everyone seems to think things are all wrong. I will be keeping an eye on what wrongs have been forgotten when everyone thinks that everything is fine. All these reflections on a seesaw brought back to mind Nassim Nicholas Taleb. I became enamored with Taleb after reading "Fooled By Randomness
And in that spirit, I leave for you a Happy New Year's treat. The chart below shows the one-day return on the S&P-500 on the first day of the new year since 1950. A total sample size of 57 years. I did not pick 1950 for any particular reason. It just seemed "right" to go for the era after the World War II years. You will note that these returns look random over the long-term, even though there is not much of a "fat tail." 27 of the 57 (47%) of the years provided positive new year cheer. There were two "out-sized" gains: 3.6% in 1988 (less than 3 months after the crash of 1987), and 3.3% in 2003 (the tail-end of the last bear market).
HAPPY NEW YEAR! And as always....be careful out there!
