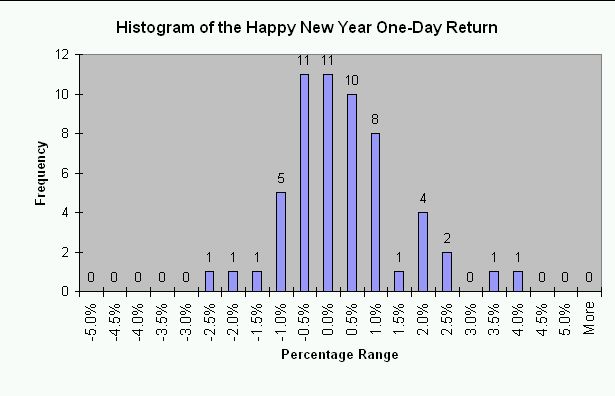
In my last missive, I examined the S&P 500's one-day performance at the start of each year for the last 57 years of trading. I notice that the overall pattern looked random with no significant "fat tail" on the distribution of returns. I dedicated that missive (and this year) to Nassim Nicholas Taleb and today would surely be a day that would make him "proud." Today, the S&P dropped a gut-wrenching -1.4%. Over my sample period of 57 years, there have only been 3, yes THREE, other years that started this poorly on a percentage performance basis. Of course, the media, with its penchant for drama (I would never stoop to drama! =smiles=), are screaming that today coughed up the largest point loss EVER for the Dow Jones Industrials to start a year. I have already pointed out why I ignore the Dow for these kinds of studies, and I give you TraderMike's post from 2006 for a great review. And who cares about total points when percentages are what matter?
The years that performed worse than 2007 for the S&P500? A -2% loss on the first trading day for 1980. The year finished UP 28.4%. A -1.8% loss on the first trading day for 1983. The year finished up 19.2%. Finally, a -2.8% loss on the first trading day for 2001. Now THAT was "prophetic" as the year ended down -10.5%. In case you are now building up hope for monster gains for the rest of the year, please note that there is absolutely NO correlation over my sample size between the first trading day of the year and the final return of that same year. In fact, the correlation is 0.08, essentially no correlation. All random.
One prediction seems a sure bet. We should expect more 2007-style volatility for 2008. After the last Fed minutes were released, the market took a hopeful leap upward, only to be beaten back down after 30 minutes or so. (I will review these minutes within the next few days - there are plenty of reasons for the market to be alarmed). So, if this kind of instant reaction to news continues and you choose to continue the dance, you will have to either buy (or short) and hold and grit your teeth over your timeframe, or try to be oh so contrary. It is going to get even harder to find "comfortable" trends. Pick your poison, maybe even a hedge or two, and be careful out there!
I post again the distribution of one-day performance for the S&P 500 for the first trading day of the year below for your reference.
