Click here to suggest a topic using Skribit. Search past articles here.
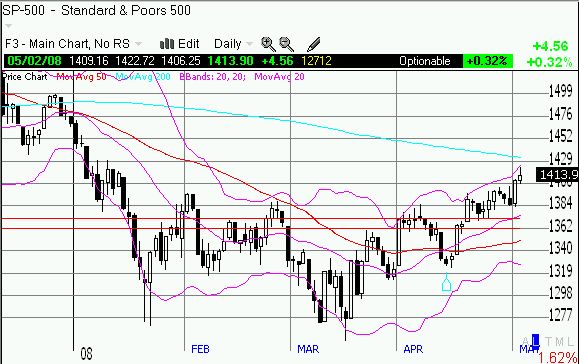
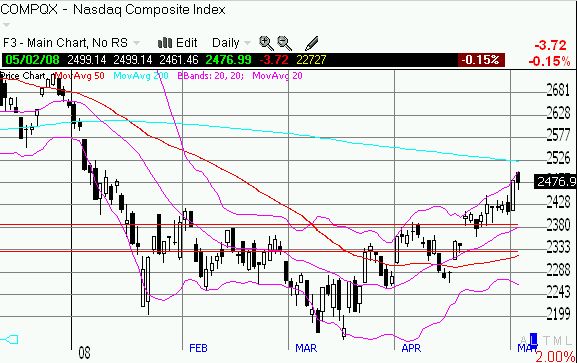
The bulls now have the full advantage. The burden is beginning to switch back to the bears to prove that the tide can (or should) turn back downward. The Fed continues to flood the system with liquidity, and the Federal government is handing out checks. The global economy continues to soldier along, inflation and all. Even if my 1200 target for a low on the S&P 500 comes to fruition somehow, it looks like we have a bone fide bottoming process in place. As I mentioned in an earlier missive, I cannot become a full bull again until GE conquers its post-earnings gap down, but the market looks "constructive" here. Almost all the signals I have been watching that kept me bearish are getting nullified and turning around for the better. For starters, both the S&P 500 and the NASDAQ have broken back above the resistance formed by 2007's major lows and are both sitting firmly in the bullish area of their charts. The lines that formerly served as resistance should currently serve as support. These lines are marked by the red horizontal lines in the graphs below.
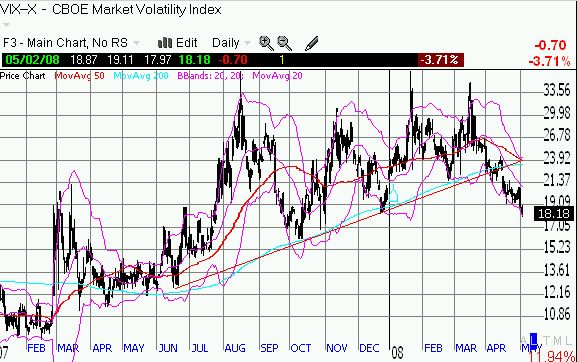
Further supporting the bulls, the uptrend in the VIX has broken decisively. The market's fear is fading away. You can see it in the market's renewed enthusiasm for risky assets (for example, paying up for over-priced solar stocks and buying into the massive dilutions of financial institutions). The chart below shows the break in the uptrend right at the beginning of April where the VIX cracked its 200DMA.
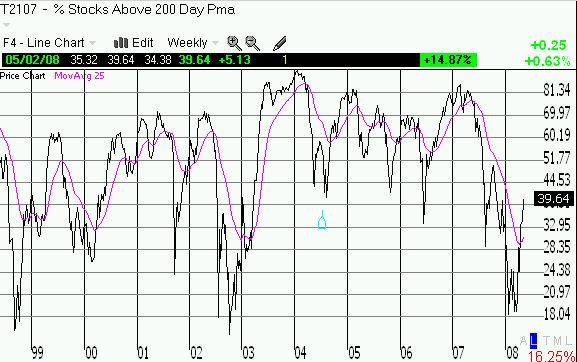
Even the T2107, the percentage of stocks above their 200 DMA, has finally broken its steep downtrend.
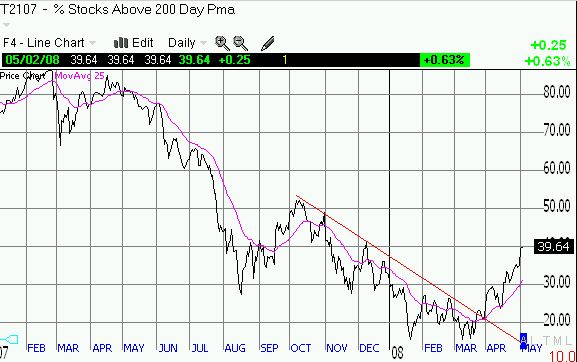
What is particularly important to note is that the T2107 bottomed right where other major bottoms have formed. The most recent examples are back in 1998 and 2002. That should tell you a LOT about the likely importance of this signal and how gut-wrenching this bottoming has been.
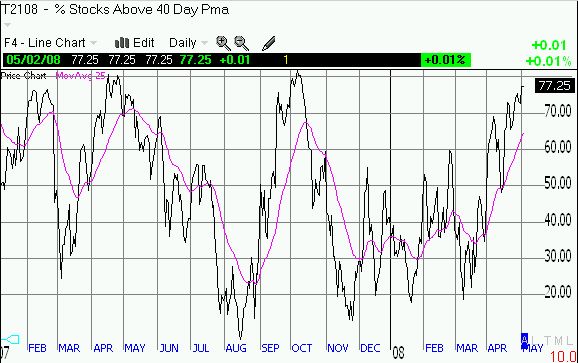
Before we get too excited, T2108, the percentage of stocks above their 40 DMA, is reaching over-bought levels. Note the very telling top we got in October from this signal. The overbought signal in April did not work quite as well as the market crawled upward another month before topping out.
The above charts of the S&P 500 and NASDAQ show overhead resistance from a declining 200DMA. These technicals should add to our caution. We should not be surprised to see a major pullback sometime soon in May that will work off these over-bought levels and likely test the above-mentioned support. That moment will be a major test that will separate the bears from the bulls. I am expecting that test to be successful only because I cannot see what catalyst would encourage the sellers to take us even lower (I previously suspected that this current breakout would prove false). I still think inflation will be our next problem and financial crisis, but the market is going to take its time recognizing the risks. The government reports of "core" inflation remain relatively tame, and the bond market is still willing to play along given GDP growth is so weak.
Be careful out there...!