An Ominous VIX Obscures the Next Stock Market Bottom
By Dr. Duru written for One-Twenty
October 8, 2008
Share Click here to suggest a topic using Skribit. Search past articles here.
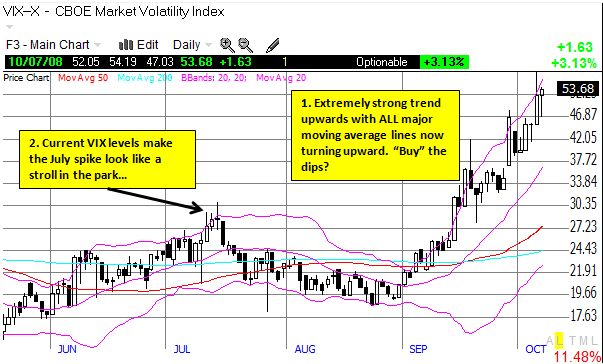
The VIX has been on a strong upward trend since the beginning of September. On Tuesday, it closed at a level not seen since the days immediately before and after the crash of 1987. Only 17 days in that period recorded volatility readings higher than what we have now. The strong upward trend gives the VIX an ominous profile: there is no firm analysis that we can apply to suggest or guess at where the VIX might top out. As trend-followers know, trends can continue far longer and far stronger than anyone expects. When such trends are in play, we typically look to buy the dips. Assuming the VIX dips when the market rallies, we should be looking to either sell the rallies and/or buy puts.

In July, I made a historic comparison between the T2108, the percentage of stocks below their 40-day moving average, and the VIX. At that time I concluded that a climactic bottom on the S&P 500 can occur when the VIX is "close enough" to the last climactic bottom. Tuesday, the T2108 was already about as low as it can go at 2.26%, and the VIX was almost double its closing high from July (see above chart). So the conclusions from that piece failed for this selling cycle. T2108 is at levels not seen since the October, 1987 crash. Only 10 days in that period recorded lower levels. Recall that when T2108 goes below 20%, the market is considered oversold. With the VIX trending upward, and the T2108 already spending seven straight days below 20%, we have the classic situation where oversold just gets more oversold. That is, the market is having trouble finding support from which to bounce. A very ominous demonstration of weakness.
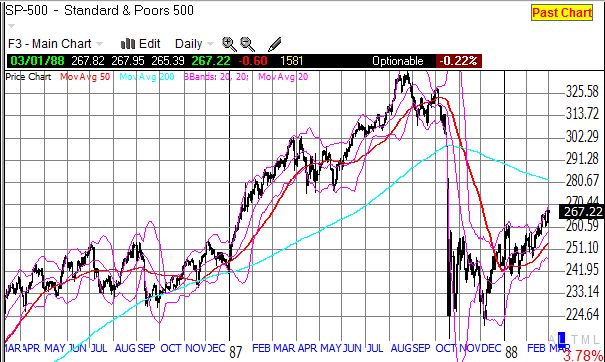
So what is the biggest technical difference between now and 1987? The stock market was soaring before the October, 1987 crash. From December 31, 1986 to September 30, 1988, the S&P 500 was up an incredible 33%. So, at the time of the crash, the market "merely" returned to price levels last seen in 1986. By the end of 1987, the S&P 500 was actually UP 5 points for the year, closing at 247.

This time? We have an S&P 500 that has cratered to prices last seen in 2003. We still need to drop another 20% to get back to the closing low of 2003 of 800 that arguably launched the last bull market. A 1987-style crash would almost certainly erase what remains of the last bull market's gains. In all my recent pieces, I never once contemplated a complete erasure of the last bull market. But now in hindsight it makes sense combining what I have written about the S&P 500 peaking and about sectors like housing and the financials erasing all of the profits from the farce that was the housing and credit bubble. If the entire economy was built mainly on the inflation of housing, then I suppose it makes sense that the entire market gets a roundtrip ticket back to the early part of the bubble.
Technical analyst Jeff deGraaf made a similar point on Fast Money in declaring that we are only in the 5th inning of the bear market (click here for video and fast forward to the 2:00 mark). The closing all-time high on the S&P 500 was around 1562 (last year). So, we have now erased about 566 points of the 762 in gains from 2003. From low to high, the S&P 500 gained 95% in 4 1/2 years. In one year, we have retraced 74% of those gains. Ouch.
I suspect all eyes remain fixated on the VIX for clues for the point where we finally get capitulation selling. But I do not think this phase of the bear market is about the VIX. Sure, we should get a spike to even higher levels if the market experiences additional selling pressure. But with the current upward trend in the VIX, it will not be the spike that sends us the signal but instead the depth of any subsequent dips.
The VIX is trending ever upward because fear in the market has led to outright panic, and the panic has a lot of momentum. Company stock buybacks have now become utter failures. Instead, companies are now racing to raise capital by diluting shareholders. This cash will not be invested and will instead be hoarded. The government's interventions have not worked as market participants remain stubbornly unconvinced that any hope exists. Few want to invest and many want to sit on cash. Every attempt to prop up the stock market has essentially failed (although one could argue that the government has at least slowed down the adjustment). Even as I write, the Federal Reserve has made another emergency rate cut of a whopping 50 basis points, and Central Banks across the globe are trying to coordinate efforts to prop up global financial markets. The folks who are panicking will once again sell into the obligatory bounce in the market (update: the sellers attacked the obligatory bounce before the market even opened and sent futures deeply into the red!). At some point, the continued failure to sustain rallies will transform panic into despair. That despair should mark some kind of real bottom, but I sure do not know what that phase looks like. Perhaps it will be a point when the sellers finally exhaust themselves, and buyers refuse to return with any conviction.
Anyone who tells you s/he knows how this will all play out is kidding you. We had an unusual start to this trading year which led me to declare 2008 the year of the black swan. I see every reason to continue to expect the unexpected.
In the meantime, I continue to pursue a strategy to favor buying during oversold conditions and selling in over-bought conditions. During this latest oversold cycle, I have tried to establish core positions that I think will eventually benefit from the on-going flood of liquidity washing over the globe's financial system, like commodities, technology, and infrastructure (at a later time, I hope to cover the spectre of unintended consequences from all this liquidity. Think 1999 and 2001-2002). At the same time, I purchase a wide net of puts as protection, selling most of the protection when the selling seems to get really intense - put buyers have a clear advantage in this kind of trading environment. I repeat the put buying either as the next rally unfolds or when it seems the selling will continue. Periodically, I add to my longs at the same time I expand the put buying. So, sometimes I selectively sell new longs into rallies. Clearly, simply staying away from the market has been the absolute best strategy for the short-term. The puts have been immensely profitable, but my strategy will only make a net profit when the longs get their acts together (note that this strategy has put me into a net profit when particular puts generate out-sized gains where I had no related, accompanying long position). However, for my particular situation, this is the only way I can make sure I have the right positions in place when the market is finally ready to bet on financial stabilization and an economic rebound. Note well that if the final destination is indeed a complete wash-out of the last bull market, this strategy is going to take a lot more time and effort to work itself out!
Be careful out there!
Full disclosure: Long the S&P 500 in an index mutual fund. For other disclaimers click here.
Share