The market wrote a great script. Good news has gently stroked the market for at least the last two weeks. We first had a quick rally in mid-August. For example, in 4 days, the NASDAQ gained 4.2%. The market stood its ground over the next week and churned and consolidated its way into "oversold" territory as the market digested the quick gains. The indices dutifully responded with another rally over the past week. A lot of this action has occurred with summer's typical low volume, but this has not stopped the bulls from celebrating. How could they not? Almost all the economic data points seem to be pointing to a stymied Fed and the much storied "soft landing":
- Job growth seems to be moderating. The latest employment report came in at a modest 128,000 new jobs - meaning the economy is not overheated and likely slowing at the rate the Fed claims it wants. Hourly earnings even increased a paltry 0.1%.
- Speculators are fleeing the housing market causing a sustained descent that promises to prevent the Fed from raising rates further, at least not without stronger inflation data.
- Minutes of the last Fed meeting revealed that the Fed is very worried about killing the economy with too many rate increases (however, the Fed also made it clear that it stands ready to increase rates if the inflation data forces its hand).
- The August inflation data came in at trend and offered hope that inflation could at least be slowing down.
- Oil and gas prices have steadily declined over the last 3 weeks and look to continue going down as the hurricane season seems to be much milder than expected...prices continued going down even as Iran openly defied the U.N. by effectively ignoring its "nuclear deadline" (note my previous missives on VLO demonstrating signs of weakness).
- Consumer spending was up 0.8% in July - the largest monthly gain all year - yet again frustrating the bears against the American consumer.
- Last quarter's GDP was revised upward to 2.9% - not too hot, and nowhere close to cold.
- The ISM survey of manufacturing conditions came in at levels suggestive of continued moderate economic activity.
- We even got news that the Federal deficit has been cut in half in a little over two years!
- All of the above news has combined to send the yield on the 10-year Treasury ever lower. We are now at 4.72%, levels last seen 6 months ago. This decline keeps the long-term, 12-year+ decline in rates well intact. (I hope you locked in some of those "high" CD rates earlier!)
Now, the bulls usually like to remind us that the markets climb a wall of worry. Lately, there has not been much to worry about, so we have to wonder whether we have just seen a small respite in the storm.
Certainly, we are now approaching the seasonally weak months of September and October. But trading the day after Labor Day should determine the market's short-term mood. If my guess is correct that the latest rally is just about over, then I would expect to see either vigorous selling on Tuesday, or, perhaps even worse, a sharp morning rally that sucks in the last bulls. This move would get faded just as strongly in the afternoon, or get faded over the rest of the week. I hate to make an absolute call on a market that is undergoing some kind of a transition, but I cannot help be wary when I overlay the technical picture.
Two weeks ago, I wrote about the coming final phase of the rally. The market has so far followed the script. We have rallied right to critical technical levels just in time for a traditional Sept/Oct sell-off. Let's review (this review assumes you are familiar with the previous posting and/or the technical terms used here):
- T2108 is now at 78. Close enough to fire the official warning signal that we are over-bought short-term.
- T2107 is now at 63 and ever so tantalizingly close to the 18-month downtrend.
- The S&P 500 is now 15 points (1.1%) away from the 4-year high it hit in May. Surely, we can get that all in one happy day...like this Tuesday.
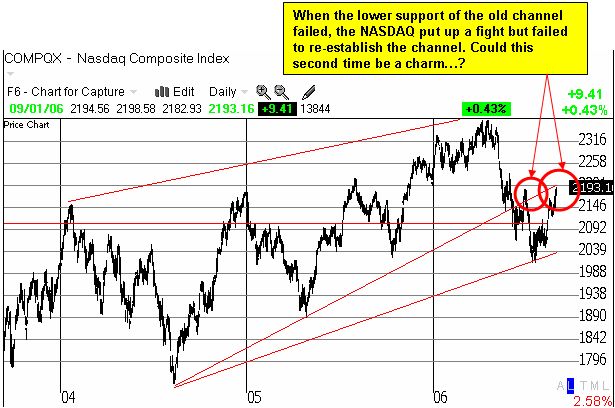
- The NASDAQ sits at the highs of July and 21 points (0.95%) away from resistance at the 200DMA AND the June high. Again, ponts that can be collected all in one happy rally day. To add to the short-term odds working against the NASDAQ, the simplified chart below shows that it now sits right at the underbelly of the old channel that held it up for two years until it decisively broke in the May/June sell-off. I will add that a lot of low quality tech names have had sharp rallies in August...a sure sign that we are lifting on vapor and fumes.

So, there is still some room to groove, but it sure seems like a poor time to initiate new longs. It is definitely time to shake the dust off your selling plan/strategy if you have not already done so. I do not know what event or catalyst will erase the recent optimism and good cheer, but it may not take much given the light volume of the past few weeks and the strong resistance levels waiting overhead. Of course, if the market manages to conquer all these warning signs, well, then I will have to jump right back on the bullish bandwagon.
In the meantime, be careful out there!